
Entry through the organiser
Entry details on the organiser’s site →
The organiser, a third party. We take no entries and have no part in the race.
 Marathon Trip
Your trips on every device: sign in, or make a free account when you save one.
Signed in on this browser.
Sign in My marathons Account and dataLocked out? An export link you keep still opens your list in any browser.
No account: email it to me
One email with this trip and a link to open it again. We do not keep the address and send nothing else.
Only a race from our list can be emailed. An account keeps this one.
What we keep, and what we do notCheck your inbox at to confirm it.
Browse the racesEach edition the day it comes out, and nothing else. Off again with one click. How it is kept.
Flat from start to finish: 7 m between the lowest and the highest point.
© OpenStreetMap contributors
Height drawn many times taller than life. Heights: GEDTM30.
Dashed: bridge

Your 2 gels, at the orange marksFor a 1:55 finish, one every 40 minutes
Get them on AmazonAmazon partner link
The lowest point is 2.3 m below sea level at 15.0 km and the highest is 4.7 m, at the finish in the Burgemeester Visserpark.
Measured
The Dutch Athletics Union (Atletiekunie) measured the half marathon course and certified it in February 2026. The 60th edition is on 6 and 7 March 2027.
Sourced
The 2026 half marathon started at 12:30 on Sunday 1 March, together with the Rabobank Businessloop half marathon.
Sourced
The 20 van Alphen is a flat course of 21.1 km with 17.1 m of climbing. Its lowest point is 2 m below sea level and its highest 5 m above it.
Entry through the organiser
The organiser, a third party. We take no entries and have no part in the race.
More races to look at after the 20 van Alphen.
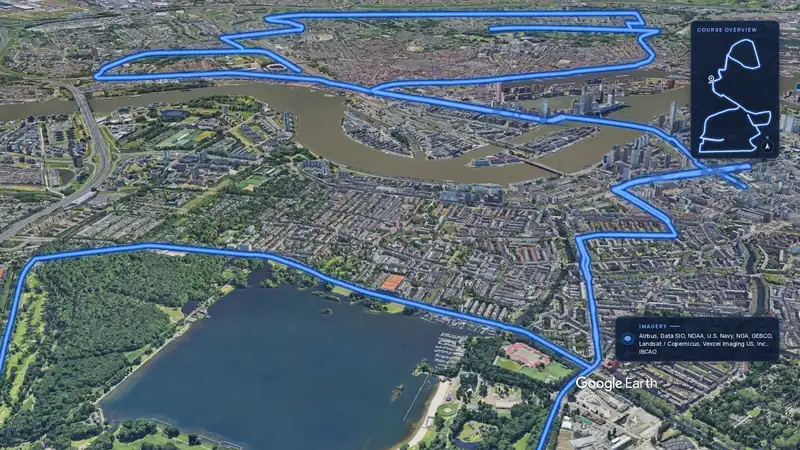 Imagery: Google Earth3:55 film
Rotterdam, Netherlands
Sun 11 Apr 202742.2 kmClimb 28 m
Climb summed after smoothing the heights over 1 km. The edge is this course's height profile on one scale for every race: 250 m above its lowest point fills it.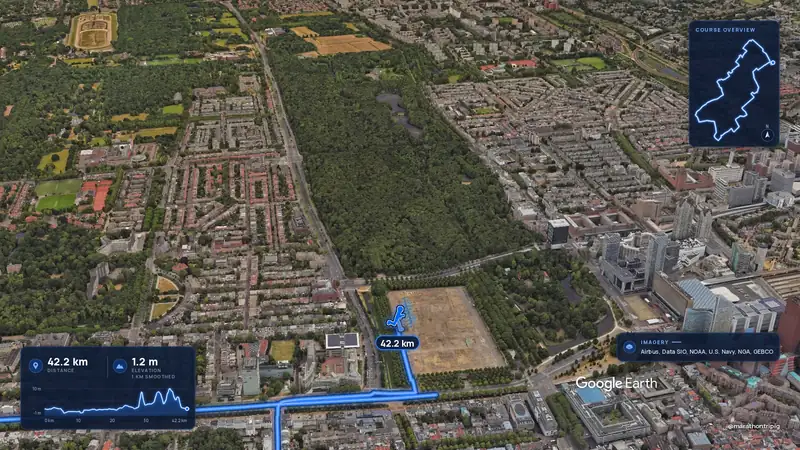 Imagery: Google Earth3:02 film
The Hague, Netherlands
Nov 202742.2 kmClimb 28 m
Climb summed after smoothing the heights over 1 km. The edge is this course's height profile on one scale for every race: 250 m above its lowest point fills it.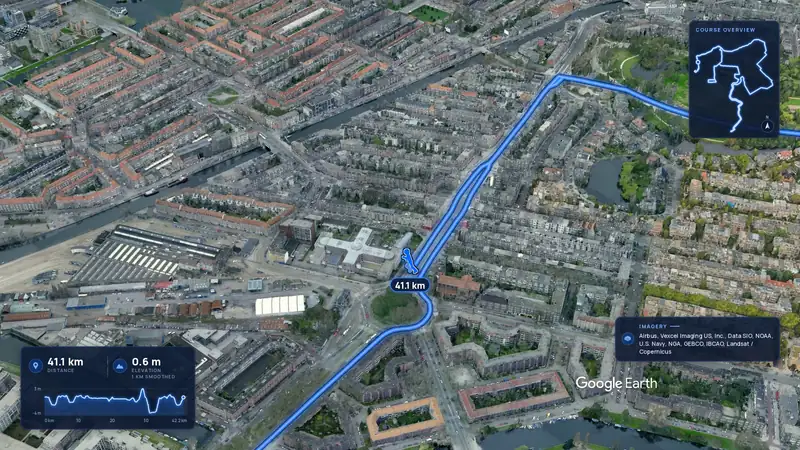 Imagery: Google Earth3:49 film
Amsterdam, Netherlands
Sun 31 Oct 202742.2 kmClimb 22 m
Climb summed after smoothing the heights over 1 km. The edge is this course's height profile on one scale for every race: 250 m above its lowest point fills it.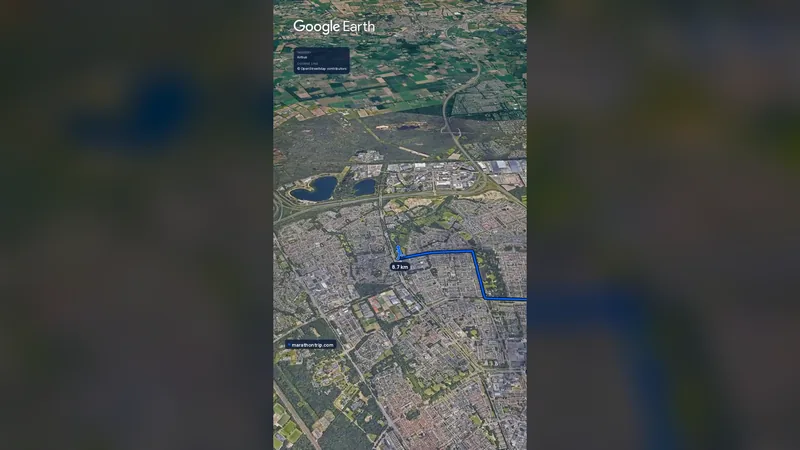 Imagery: Google Earth0:58 film
Eindhoven, Netherlands
Sun 10 Oct 202742.2 kmClimb 17 m
Climb summed after smoothing the heights over 1 km. The edge is this course's height profile on one scale for every race: 250 m above its lowest point fills it.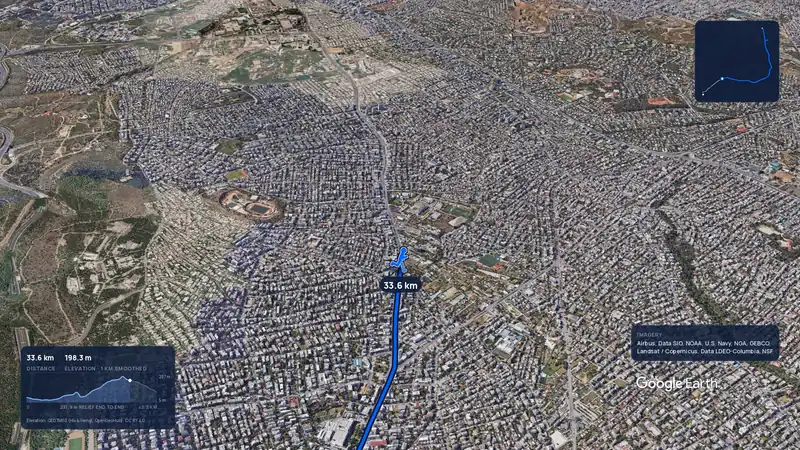 Imagery: Google Earth3:56 filmRace week
Athens, Greece
Sun 8 Nov42.2 kmClimb 281 m
Climb summed after smoothing the heights over 1 km. The edge is this course's height profile on one scale for every race: 250 m above its lowest point fills it.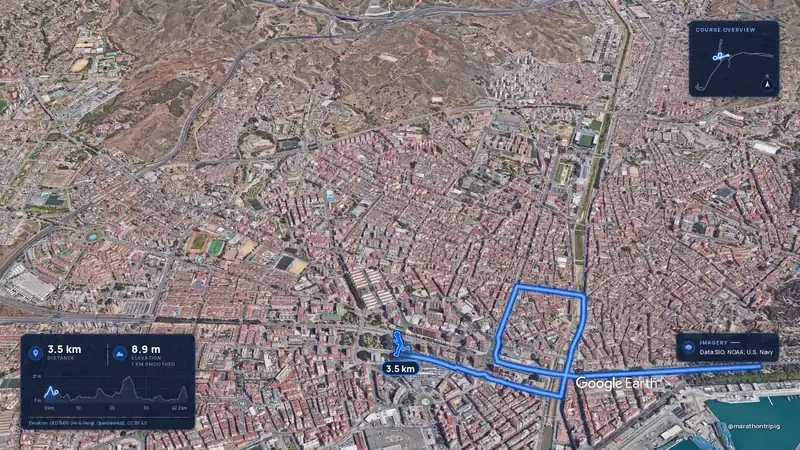 Imagery: Google Earth3:50 filmRace week
Malaga, Spain
Sun 8 Nov42.2 kmClimb 63 m
Climb summed after smoothing the heights over 1 km. The edge is this course's height profile on one scale for every race: 250 m above its lowest point fills it.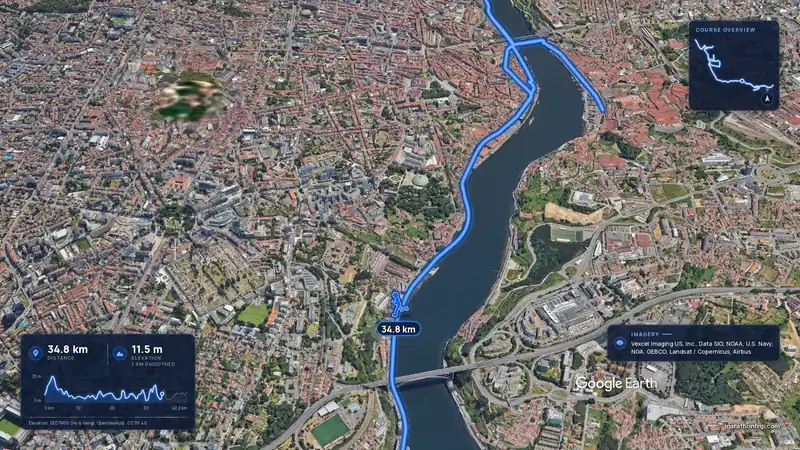 Imagery: Google Earth3:53 filmRace week
Porto, Portugal
Sun 8 Nov42.2 kmClimb 133 m
Climb summed after smoothing the heights over 1 km. The edge is this course's height profile on one scale for every race: 250 m above its lowest point fills it.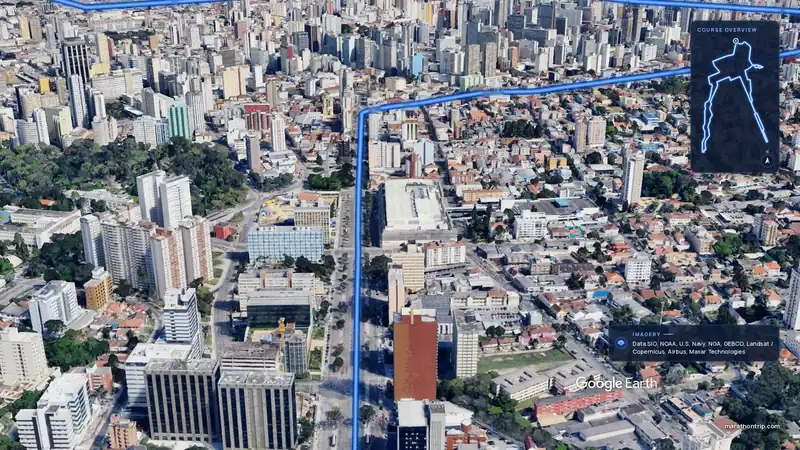 Imagery: Google Earth3:51 filmEntry open
Curitiba, Brazil
Sun 15 Nov42.2 kmClimb 128 m
Climb summed after smoothing the heights over 1 km. The edge is this course's height profile on one scale for every race: 250 m above its lowest point fills it.